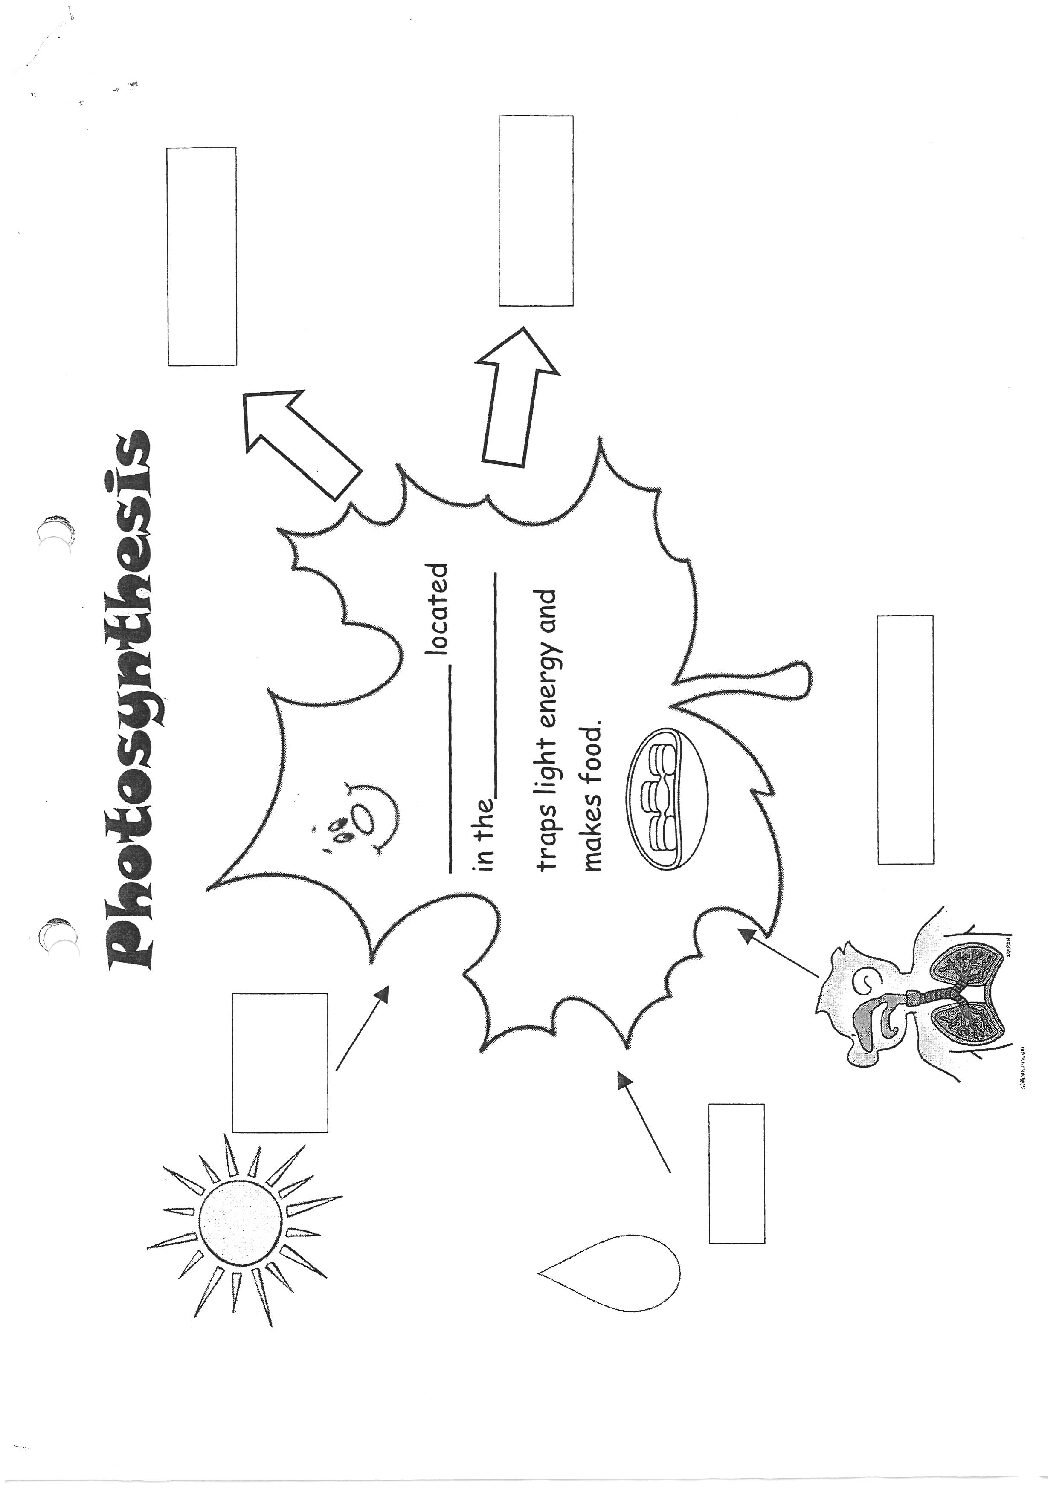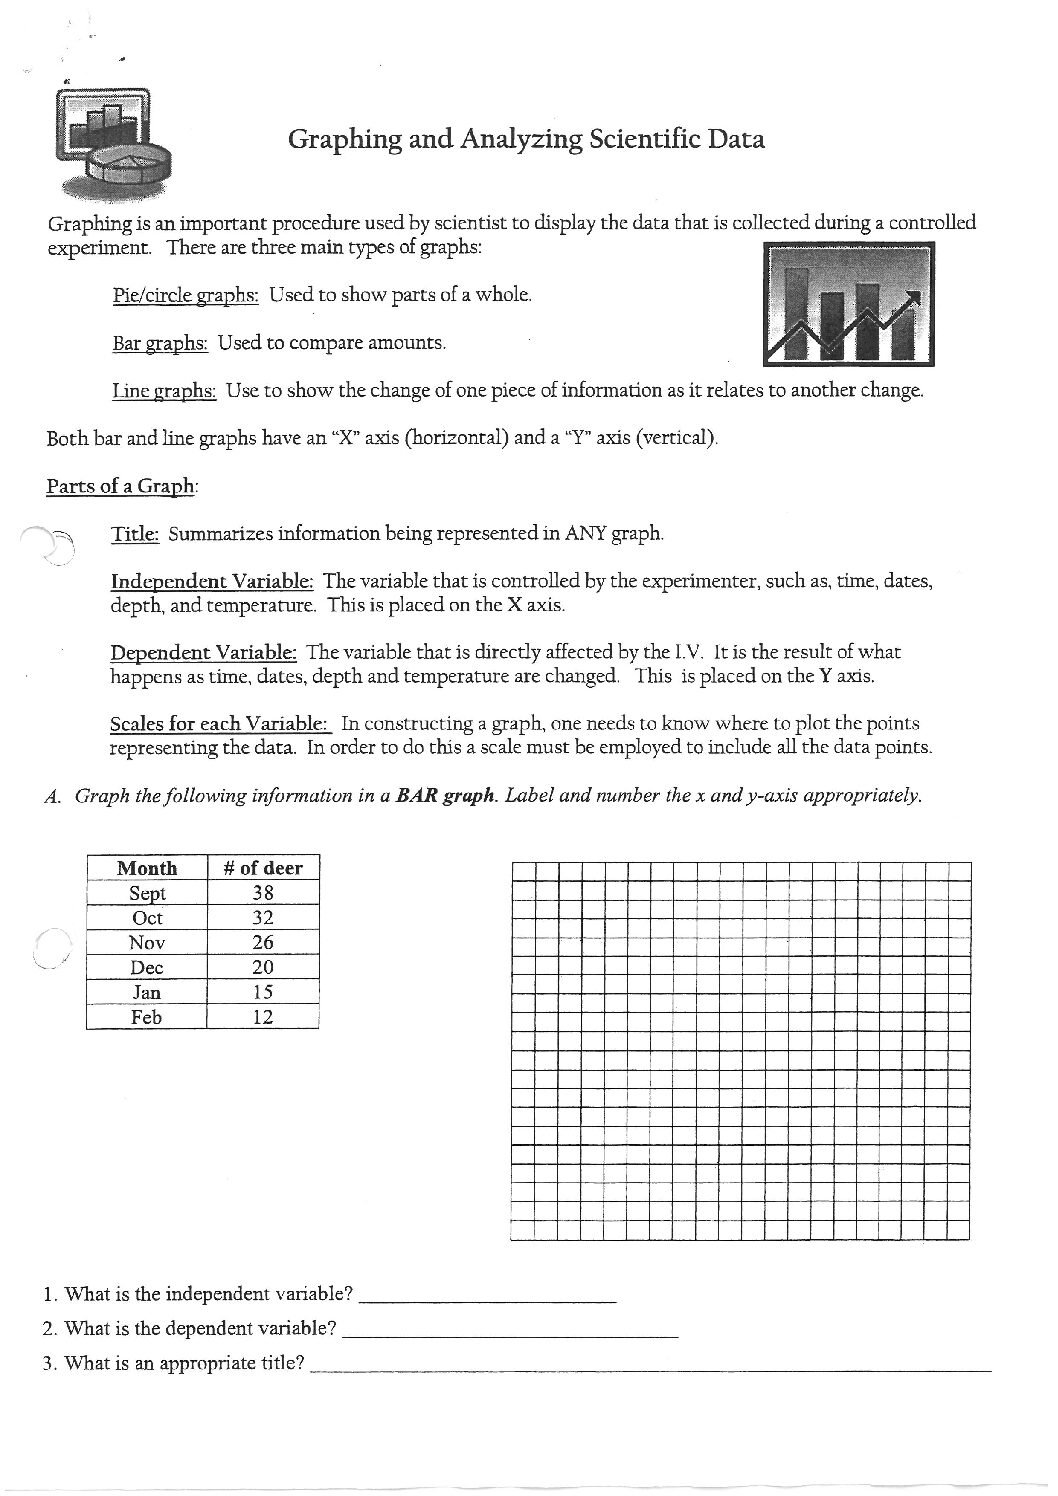
This comprehensive worksheet is designed to help students practice graphing and analyzing scientific data. It covers essential skills such as creating line graphs, and bar graphs and drawing conclusions based on the data presented.
Key Topics Covered:
This worksheet is perfect for middle school and high school science classes, providing hands-on practice to reinforce important graphing and data analysis skills. It can be used as a standalone activity, homework assignment, or as part of a larger unit on scientific inquiry and data analysis.
You must log in and be a buyer of this download to submit a review.