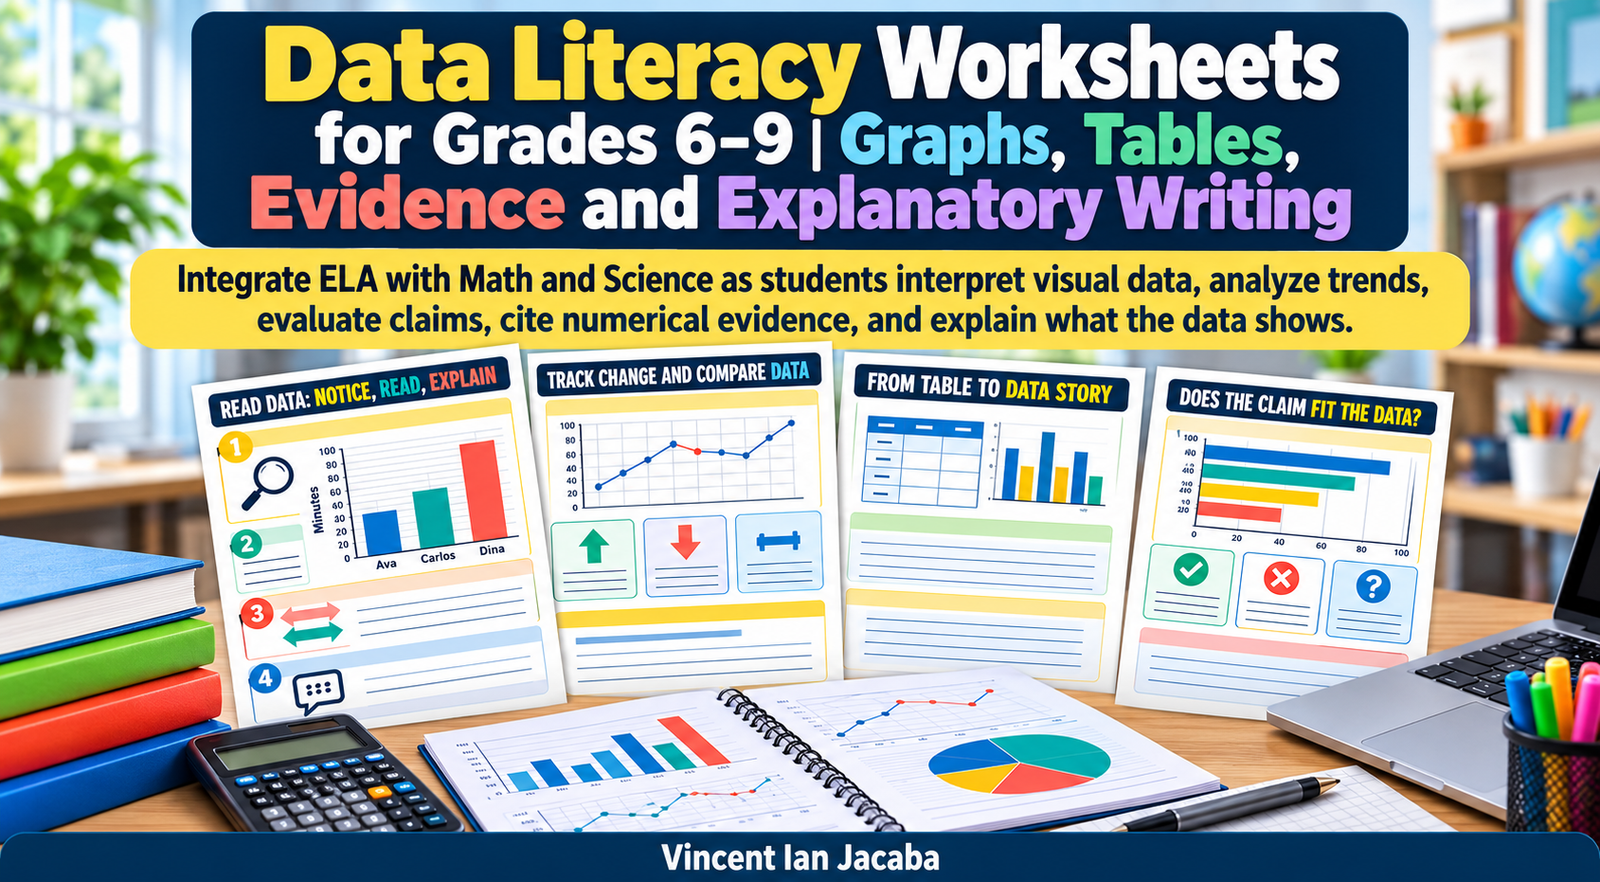
Build confident data literacy skills with this engaging cross-curricular resource for Years 7–10. Designed to integrate English, Maths and Science, these worksheets help pupils interpret graphs, tables, scatter plots and other visual data while developing evidence-based reasoning and explanatory writing.
Practise reading and comparing numerical data accurately
Identify trends, changes, patterns and turning points
Evaluate whether claims are supported, contradicted or not proven by the data
Distinguish association from causation
Analyse potentially misleading graphs and visual representations
Select relevant numerical evidence to support conclusions
Develop clear, accurate explanatory and evidence-based writing
Includes scaffolded worksheets, instructional reference pages and answer keys
Suitable for whole-class teaching, independent work, intervention, revision and assessment
File type: PDF
The activities progress from foundational graph and table reading to more advanced data interpretation and culminate in a Data Story Capstone requiring pupils to synthesise information from multiple data sources. Ideal for strengthening quantitative literacy, critical thinking and cross-curricular communication skills.
You must log in and be a buyer of this download to submit a review.